This website uses cookies so that we can provide you with the best user experience possible. Cookie information is stored in your browser and performs functions such as recognising you when you return to our website and helping our team to understand which sections of the website you find most interesting and useful.
OverOps + Splunk
Net new machine data provides granular insight in Splunk
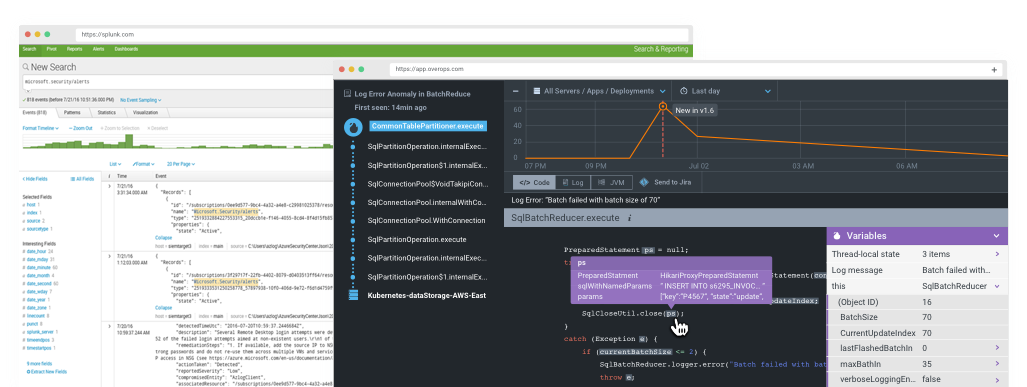
Machine Data Beyond Log Files
Complete insight into every error in your applications.
- Complete variable state, call stack and source code across the stack
- Last 250 log statements, including DEBUG and INFO
- Classify events as new/reintroduced and associate to a build
- Get frequency and failure rate for 100% of errors and exceptions
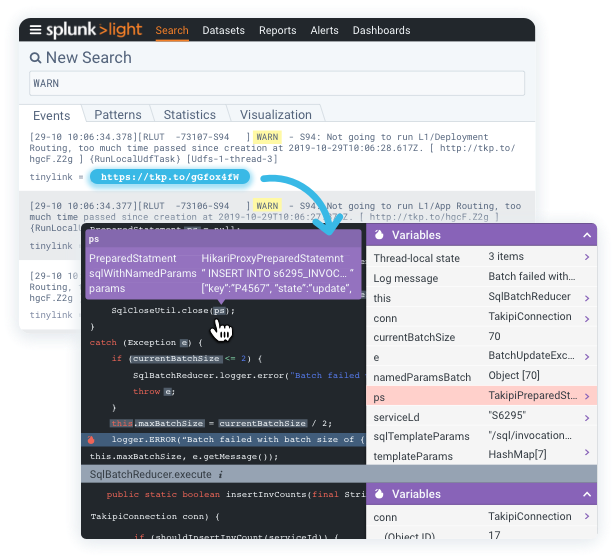
One-click access to root cause
OverOps inserts tinylinks into your log files
- Tinylinks connect Splunk directly to root cause
- Use OverOps machine data to troubleshoot quickly
- Ease communication between QA and development
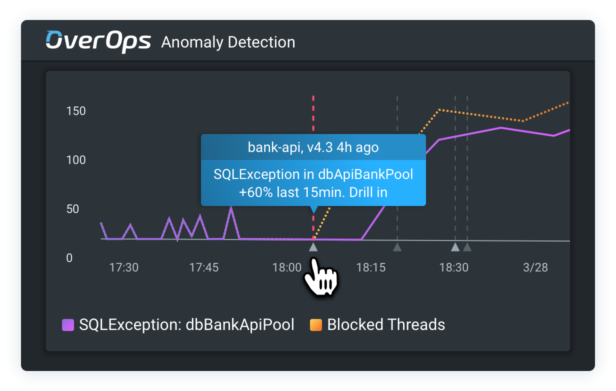
Cut through the noise
OverOps classifies and streamlines events
- Deduplicate billions of log events without parsing
- Identify regressions: correlate to code changes & agile deployment
- Detect anomalies amongst billions of errors
Visualize Reliable Software
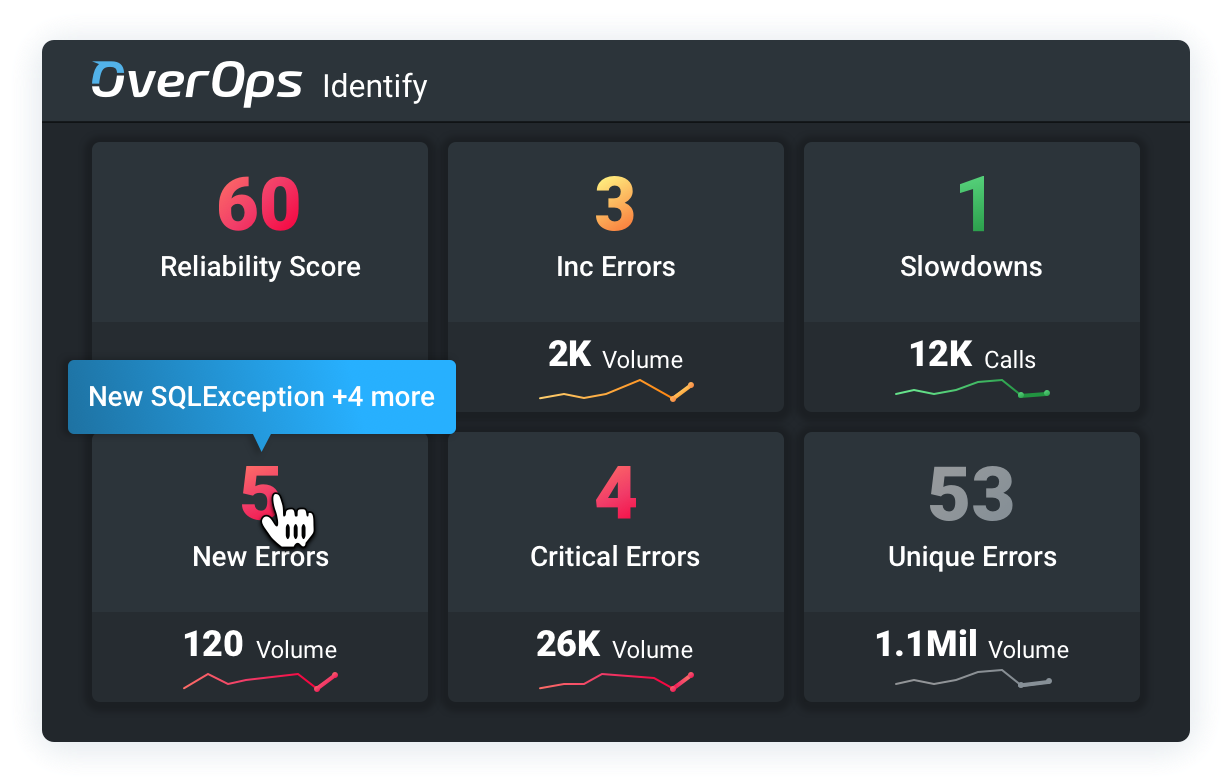
Integration with Splunk Metrics Dashboard
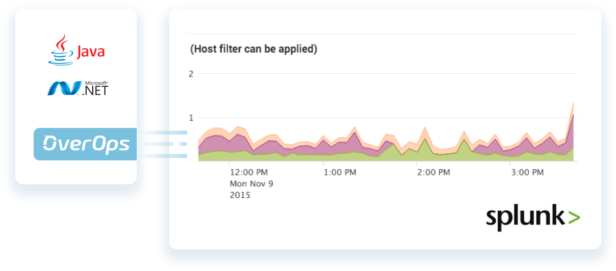
- Visualize OverOps data in Splunk
- Segment views by build, release, application
- View overall quality by team or individual
We Work the Way You Work
OverOps integrates with your existing tools, making your CI/CD pipeline 10x smarter
Featured Content
Free eBook
Delivering Reliable Software in the Enterprise
Download Now >
Blog Post
Handling ‘Known Unknowns’ and ‘Unknown Unknowns’
Read Post >
2020 Survey Report
How are today’s engineering teams addressing the speed vs. stability paradox?
Read Report >


